
Beyond life sciences, for any team whose data can’t leave
Your most sensitive data is exactly the data you can’t send to an AI.
Population, health, environmental and infrastructure records you can’t put into a public model. Syno runs where your data already lives, so your team asks in plain language and gets answers back as auditable, reproducible code. The data never leaves.
Runs in your environment · audit trail on every analysis · built to support GDPR & EU AI Act compliance
The data you most want to use is the data you least can
You hold centuries of records across population, health, environment and infrastructure. The best questions cross all four, and never get asked.
Each one is a project only a handful of specialists can run, and they’re already a queue. Worse, the data is exactly what you can’t paste into a public AI: law, mandate and public trust forbid the export. So the cross-domain questions, like whether the heat rising in your climate data shows up in your mortality data, sit unanswered.
Syno opens that work to your whole team without loosening governance. Anyone can ask in plain language, and every analysis ships as inspectable, reproducible, auditable code. Your experts review the output instead of building it from scratch. The analyst comes to the data; the data stays put.
Why this is finally possible
The questions stayed locked up because conventional AI makes you send the data out.
That export is what turns every question into a months-long security and transfer review, the review a public body can rarely clear at all. Syno runs where your data already lives, so there is nothing to export and that review largely falls away. Your own security review still happens, and the Trust Center is built to make it fast.
This is what turns a multi-agency data project into a question you ask on a Tuesday.
What you can finally ask
One platform across your whole mandate, not one tool per silo.
Unlimited seats let the whole organisation draw on the data without growing headcount. Every example below is shown further down, produced on real public data.
Population & public health
Excess-mortality and demographic questions on your own registry data: the analysis that used to be a multi-month specialist project, returned as reproducible code your team can inspect.
Climate & environment
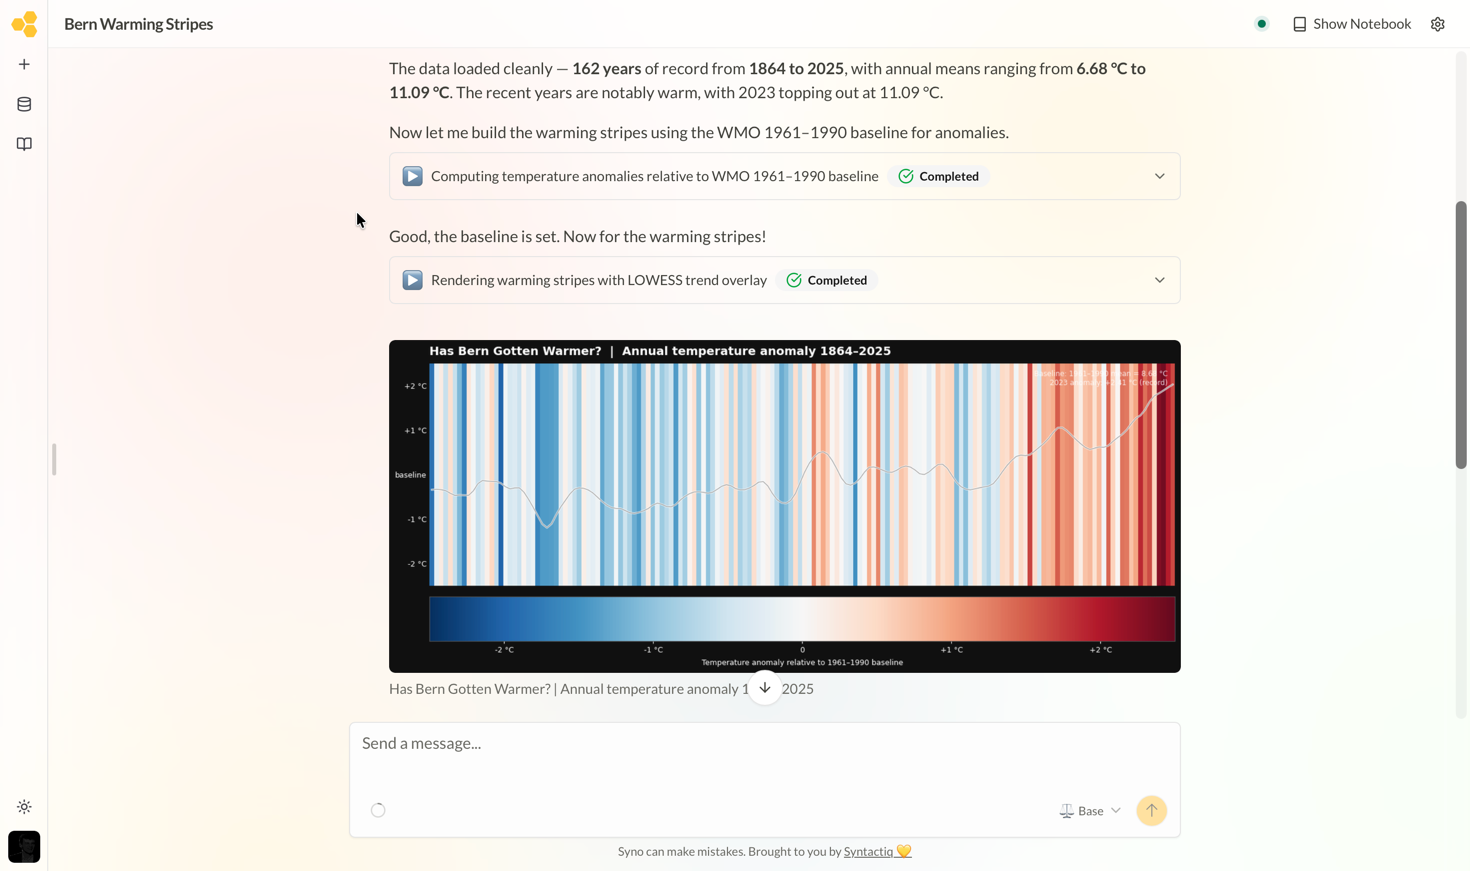
Long-run trends across station and sensor records: warming, snow-cover and air quality, mapped spatially and tested for significance rather than eyeballed.
Infrastructure & energy
Demand, load and utilisation against weather and season: the planning questions that inform capacity, resilience and procurement.
Across the silos
The questions no single-domain tool can answer: does the heat rising in the climate record show up in the mortality record? Syno joins them on a shared key and quantifies the link.
See it on real, public data
One question became four, and crossed the domains most tools keep apart.
Everything below was produced by Syno in a single session, on Swiss federal and cantonal open data, the same way it would run inside your boundary on your own data. We used public data so you can check every number yourself before you share a single record.
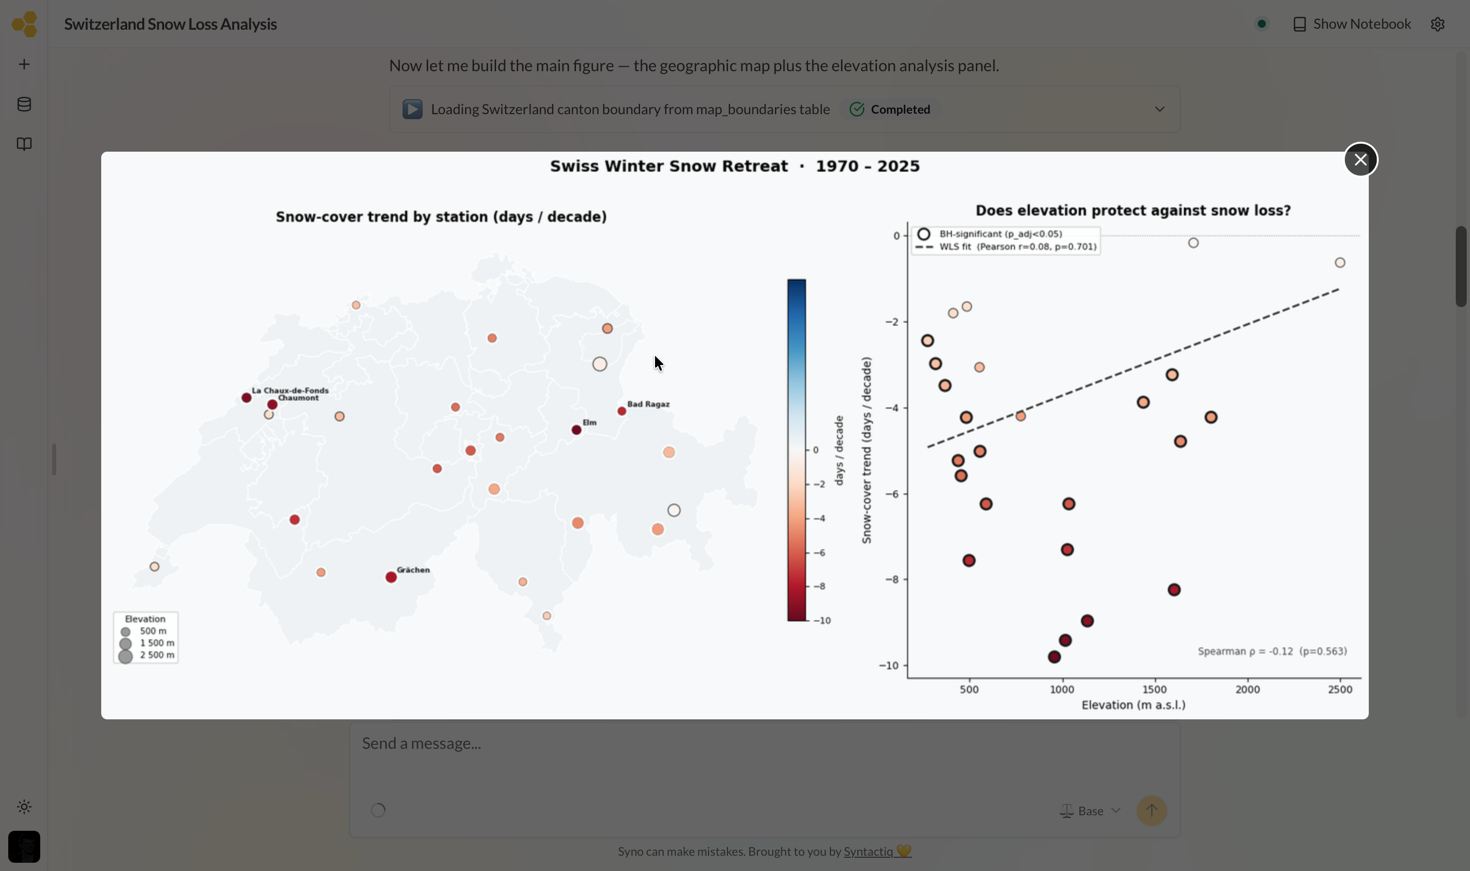
Where is the snow line retreating fastest? Every weather station placed geographically, coloured by its snow-cover trend and sized by elevation. The low and mid stations are losing the most; the high Alps hold on. Drawn offline, inside the environment, with a significance test on every station.
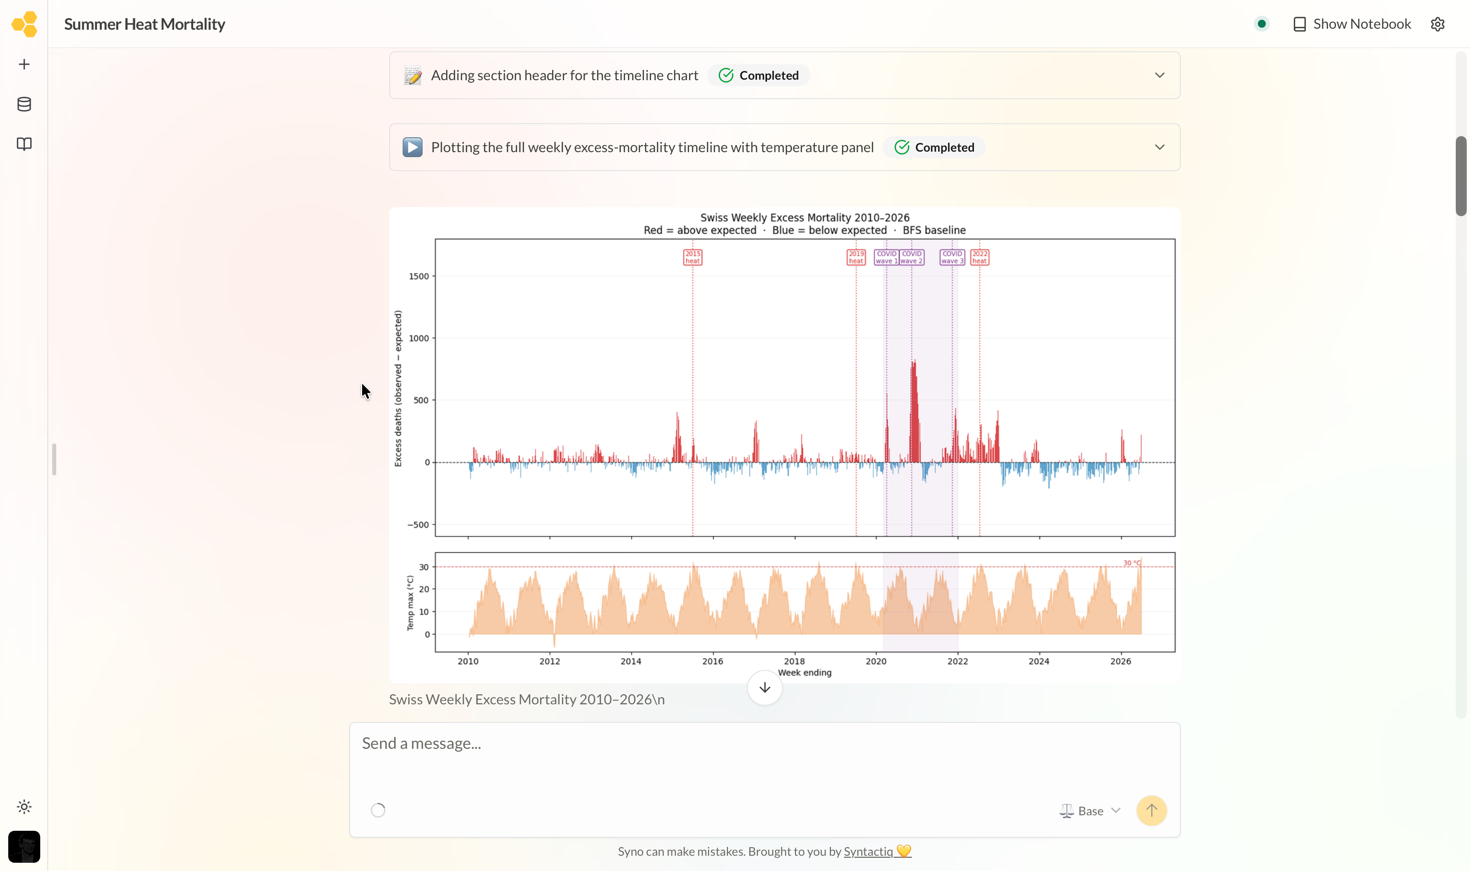
Public health. Weekly excess deaths against the official baseline: the 2015, 2019 and 2022 heat summers stand out against COVID.
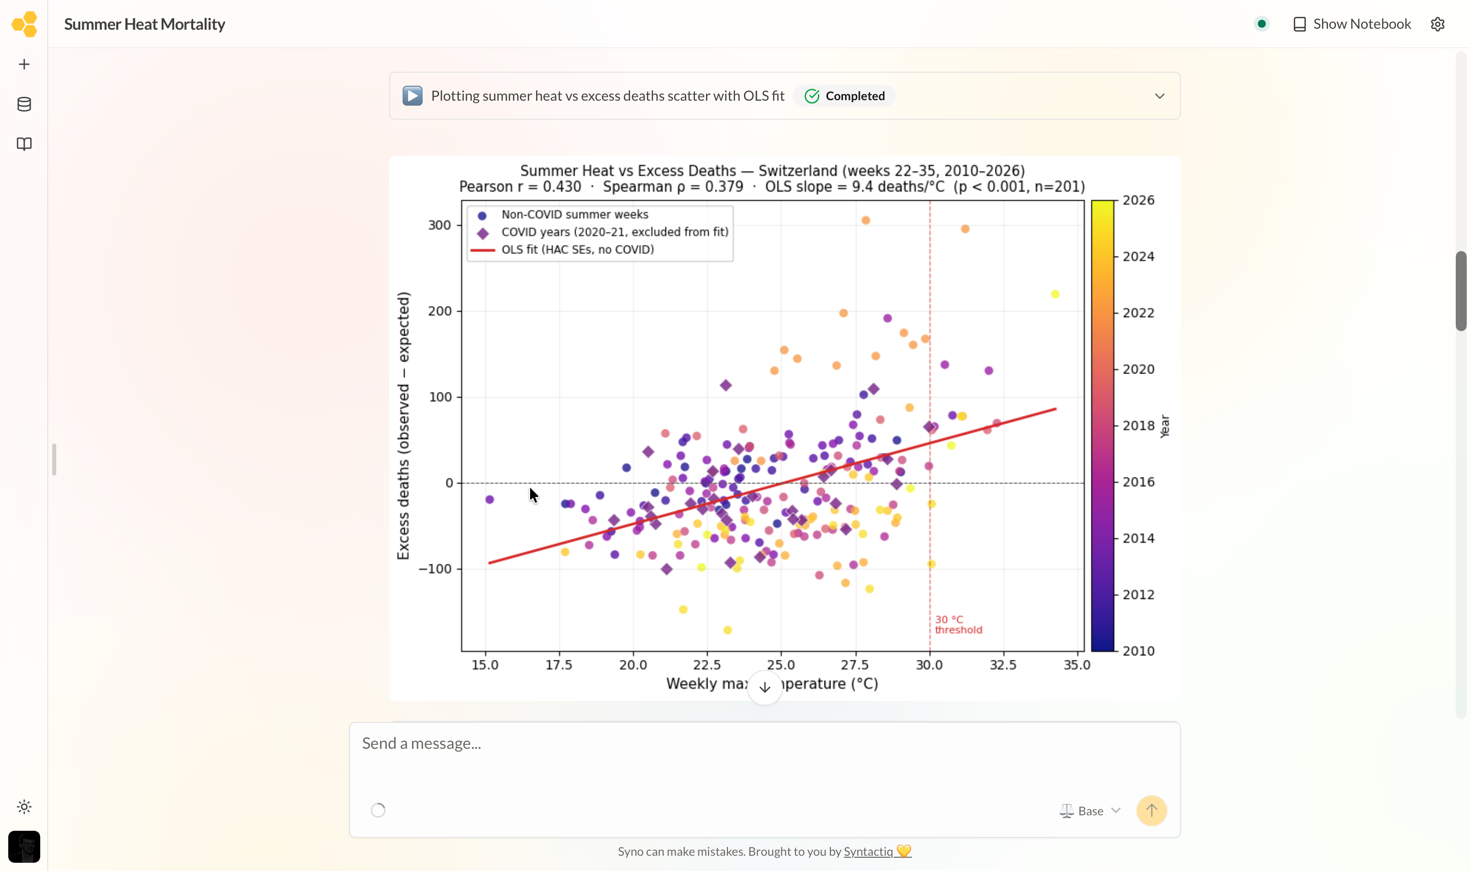
Across the silos. The climate record meets the mortality record: +9.4 excess deaths per °C of summer heat, COVID years held out of the fit.
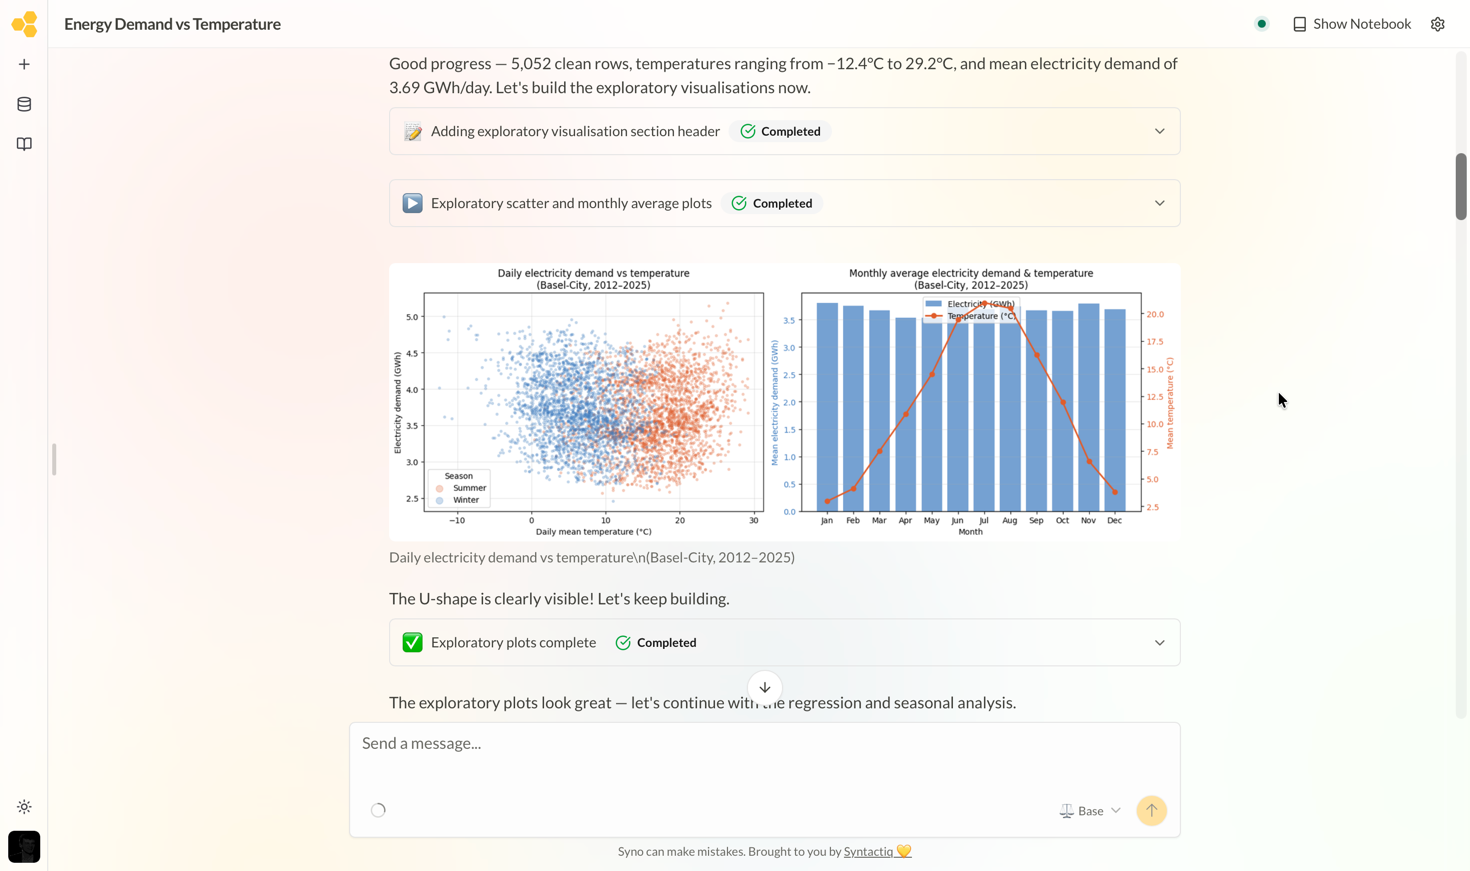
Infrastructure. Electricity demand against temperature: the U-shaped heating-and-cooling curve that drives capacity planning.
And it tells you where it’s unsure
The heat-and-mortality analysis shipped with its own caveats: an ecological study on national aggregates, a linear model on a relationship that steepens above 30 °C, an association rather than a causal estimate.
An analyst that flags the limits of its own finding is the one a methodologist, and an auditor, can actually trust. Every result comes with the code that produced it and the audit trail beside it.
Where Syno runs
Be precise about where the AI runs. We are.
For identifiable public-sector data, choose one of these modes. A separate Managed-Global mode exists for non-identifiable, exploratory data only.
Air-gapped
On-premises, with no outbound network connection at all. The demo above runs its maps and models fully offline, the same way it would in a sealed environment.
Self-hosted
Your own cloud or VPC, your own or open-source models. Fully in-boundary, so nothing leaves your environment.
Managed-EU
Runs on EU-resident managed infrastructure. A named EU sub-processor (disclosed in the Trust Center) handles inference; your data is never used to train models.
Every outbound connection and inference location is drawn out, per mode, in the Trust Center.
The fastest way to judge it is to use it, on the same public data you just saw.
Before you ask
The questions your IT, DPO and procurement teams will raise.
How is this different from ChatGPT?
In short: where it runs and what it leaves behind. Syno runs where your data lives and ships auditable code, not just an answer, so there’s no export to review in the first place.
See the full comparison →A Trust Center your team can open today
Data-flow diagrams per mode, compliance posture, the sub-processor list, and the documents your security review needs.
Open the Trust Center →Are we your first public-sector customer?
In this segment you’d be among the first, and we won’t fake a logo we don’t have. Syno already runs on-premises for Europe’s largest Type 1 Diabetes consortium on sensitive health data; founding public-sector partners get a real say in the roadmap.
Frequently asked
Where do the models actually run?
You choose the mode. Air-gapped and self-hosted keep everything inside your boundary. In Managed-EU, inference runs on EU-resident infrastructure through a named sub-processor and is never used to train models. The per-mode data-flow diagrams live in the Trust Center.
Does it fit GDPR and the EU AI Act?
Every analysis ships as inspectable, reproducible code with a full audit trail, designed to support data-protection and transparency obligations. Ad-hoc analyses are reproducible too: the generated code reruns deterministically on the same data. The DPA and DPIA review run in parallel with deployment, not as a second cycle.
What will our DPO and procurement teams need?
A ready-to-sign DPA, a DPIA starter, the sub-processor list, and our no-training-on-your-data contractual commitment. All of it is available through the Trust Center, the gated items under NDA.
Ask the cross-domain question that’s been waiting.
Book a demo with our team on your own data, or try Syno now on the same public data you just saw.